The Disabled Self-Employed Data Brief
We reviewed the conditions and experiences of the disabled self-employed to build on our understanding of the sector and help to better support it.

Introduction
Throughout 2019, IPSE researched the conditions and experience of the disabled self-employed to build on our understanding of the sector and help to better support it.
This research built on a 2018 report we carried out with Community trade union to understand more about the disabled self-employed. The evidece-based report answered some of the key questions that have gone unanswered for too long: Who are the disabled self-employed? What are their key motivations, experiences and challenges? And where there are problems, what can be done to improve the situation?[1]
What we found was encouraging. The majority of disabled people we interviewed had a positive view of self-employment, they felt it met their needs where employment couldn’t, and intended to stay in it for the long-term. In our report, we also set out a list of recommendations for government, the private sector and support organisations to ensure that all disabled people who are currently self-employed or considering it, can make a success of this way of working.
We continued this research throughout 2019, finding both continuity and also interesting new results. These are presented below.

Size of sector
Office for National Statistics (ONS) data shows that the number of self-employed people in the UK registered as disabled under the Equality Act now stands at 662,000.[2] This is up eight per cent since 2018 and 41 per cent since 2013.
In comparison, overall self-employment saw an increase of four per cent between 2018 and 2019.

Gender
There are more disabled men (60%) than women (40%) in self-employment. The opposite can be found among disabled employees where 40 per cent are men and 60 per cent women.
The number of disabled women in self-employment has increased at much faster rates than men with increases of 12 per cent (almost 30,000 people) in the last year and 66 per cent since 2013.
Age
The average age of the disabled self-employed is 51 years, which is higher than the average age of disabled employees (44 years) and the overall self-employed population (47 years).
The biggest increase in disabled self-employed people between 2018 and 2019 was in the over 60s group, seeing an increase of 25 per cent in the last year, equivalent to 40,000 individuals.
Younger people (16-29) remain a smaller group, but have over doubled in the last six years to 46,000.


Occupation
The largest proportion of disabled self-employed people (24%) are working in skilled trade occupations.
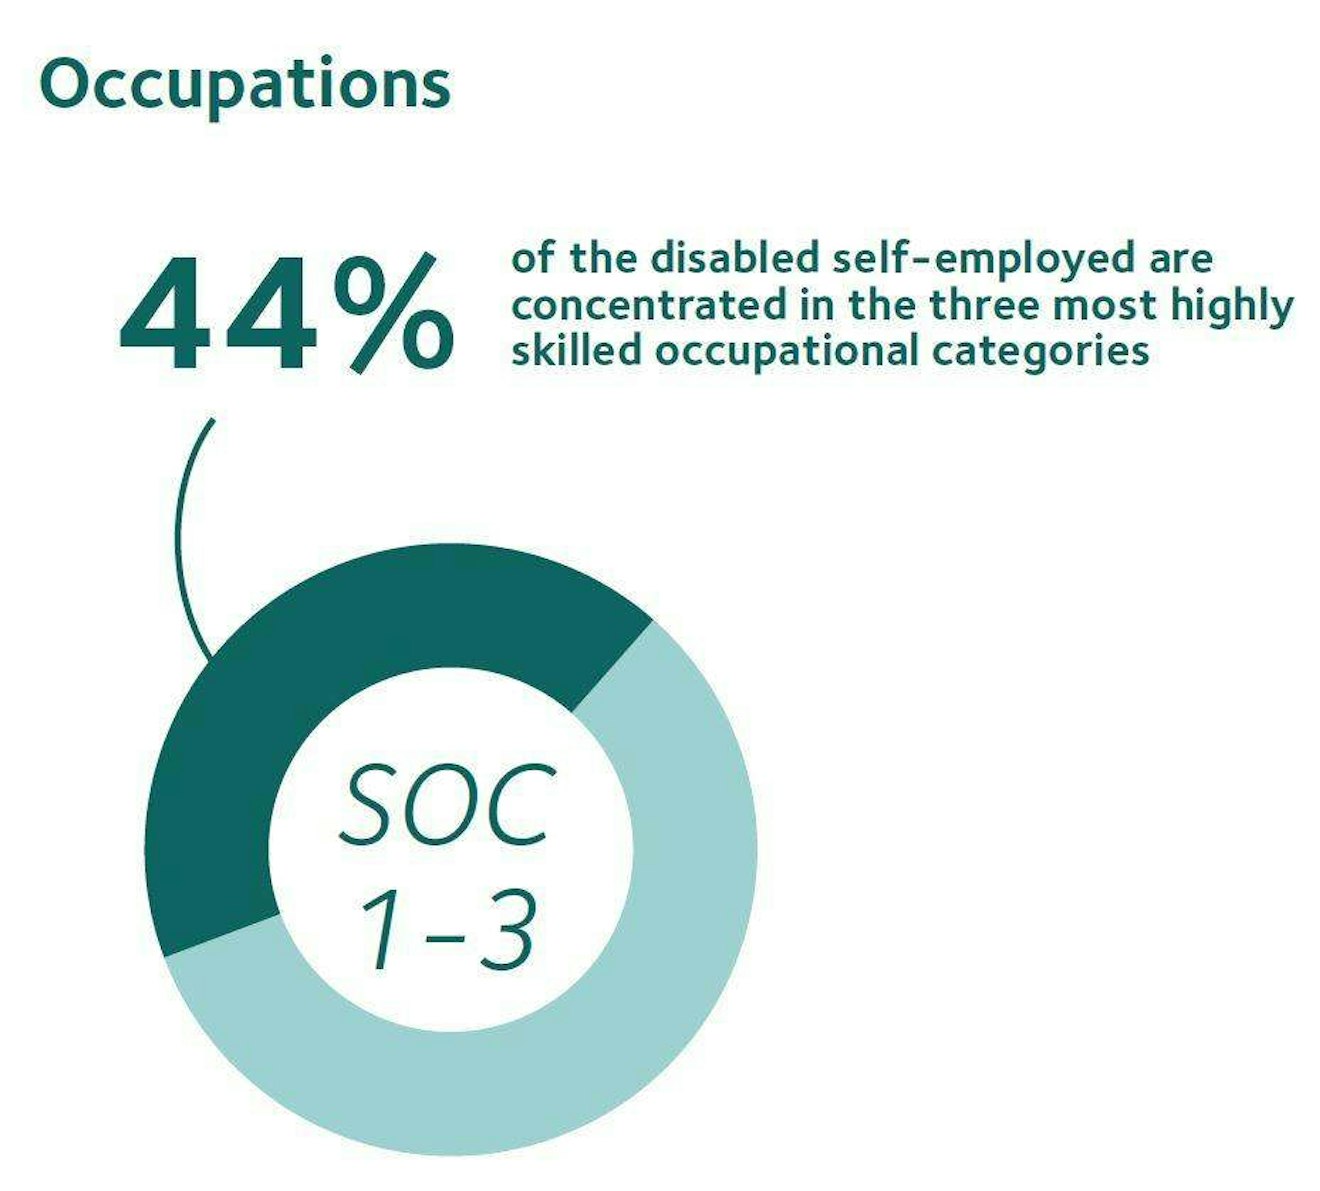
A further 44 per cent are working in the top three ONS standard occupational categories (SOCs) 1 to 3 which includes managers, directors, professionals and associate professionals. This is higher than the proportion of disabled employees working in SOCs 1 to 3 which stands at 38 per cent.
Length of time in self-employment
Disabled people seem to be in self-employment for the long run with almost half (47%) reporting they have been be self-employed for over 10 years.
Another quarter (26%) have been self-employed for three years or less; and a fifth (19%) have been self-employed for four to seven years.

Motivations to enter self-employment
Primary survey data reveals that people who suffer from long-term disabilities seem to enter self-employment for overwhelmingly positive reasons, including greater control of hours (52%) and control over their work (51%), as well as a better work-life balance (47%).[3]
However, they are more likely than non-disabled people to say that they entered self-employment because they preferred to work alone than in a team (34% vs 28%), lacked other employment opportunities (26% vs 20%), had no opportunities for career progression in their previous job (21% vs 14%) and experienced discrimination in their previous job (14% vs 8%).
Experiences in self-employment
Disabled self-employed people are more likely to command a lower day rate (£152) in comparison with those who do not report a disability (£172).
In fact, their day rates are on average 12 per cent lower than self-employed people with no disability.
They are also more likely to find looking for work challenging (21% compared to 16%) and a smaller proportion of them report being happy in self-employment (73% compared to 82%).
Almost three in four (73%) disabled people say they are happy being self-employed.

Latest news & opinions
IPSE’s Josh Toovey argues that a changing risk–reward balance is making self-employment a harder choice for many people in the UK.

IPSE’s Managing Director, Vicks Rodwell, outlines how our new partnership with Qdos strengthens member protection, enhances expert support and delivers expanded b...

IPSE's Josh Toovey explains why 2026 could bring renewed opportunity for the self-employed after a tough 2025 of limited projects and rising costs.


